I’ve also been evaluating skylake, and I’m a little skeptical about those rosy performance numbers.
You linked to two javascript benchmarks on anandtech; kraken and octane. Those post considerable performance gains, but there are lots of warning signs indicating that there’s something fishy going on.
If you look at a full comparison between the 6700k and the 4790k, you’ll note that most benchmarks show little to no change. There are exceptions: integrated graphics has definitely improved (but you won’t care), and there are new instructions that improve targeted workloads (e.g. OpenSSL) - but again, that’s not going to help the ruby interpreter. Also, exceptionally, the JS benchmarks have significantly impoved: Krakenjs for instance achieves a score of 735ms vs. the 4790k’s 938ms. A whopping 28% faster at roughly the same clockspeed!
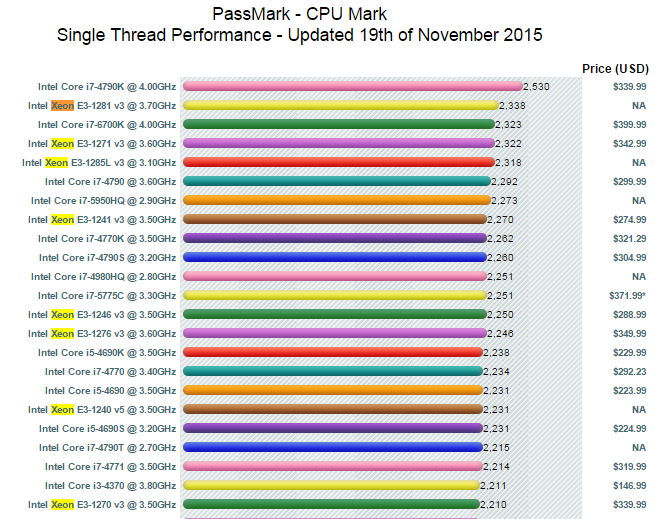
But… my 4770k currently achieves 819ms running at 4.0Ghz (turbo off) in krakenjs despite lots of processes running, which is considerably better than anandtech’s 4790k score (which nominally runs at 4.0 but turbo’s to 4.4) of 938ms, even though that processor should probably be turbo-ing the whole benchmark and is otherwise identical. It should be up to 10% faster, not 15% slower - it’s quite possible the javascript engine was updated in the meanwhile. Similarly, the 1091ms score for the 4770k in the image is again slower that you’d expect based on clockrate alone, even compared to the 4790k. That fits the theory that JS engine improvements play a role since the 4790k was tested later (it’s much newer).
The reason I focus on kraken is that octane v2 is an interesting benchmark in that it touches a broad spectrum of javascript use cases, including compiler latency. That makes it great for looking at a broad spectrum of issues that a real browser needs to handle, but it unfortunately also makes it very sensitive to browser engine details. There are large differences between browser engines here (even versions of the same engine), particularly when you look in more details at the subscore. Also, the run-to-run variation is much higher than in the simpler, mostly number-crunching krakenjs. Krakenjs scores are generally comparable across modern js engines (they tend to differ by much less than 50%), and that’s probably a better bet for comparing CPUs (on a tangent, the iPad pro is quite interesting there). Regardless, on octane v2 data is less clear, but the trend is the same as for kraken: differences in anandtechs scores cannot be easily explained by any other processor performance benchmark, nor can I replicate them at home or work on similar machines.
Now, if you disregard the anomalous JS results for a moment, there are other benchmarks that look at least vaguely like a ruby workload. For example, the dolphin emulator benchmark hopefully has some similarity - I think I’d pick that as my best bet barring an actual ruby benchmark. And you’ll note that there the skylake advantage is much smaller; it’s just 5% faster. Office productivity may also be roughtly similar; there we observe a 4% advantage. 7-zip compression shows a full 11% advantage, but that’s highly memory-system sensitive, and I’m not so sure it’s representative of your use case. Decompression is juts 6% faster. Redis is 4-17% faster (1x 4%, 10x 17%, and 100x somewhere in between). Agisoft photoscan’s CPU mapping speed is another plausible best case, with a 17% performance advantage.
I really don’t think 33% is realistic. I’d expect no more than a 5 to maybe 10% advantage at identical clockspeeds - of course, that’s not quite the case for you, so that might add another 10% for you. In your case, you might hope for 20% improvement - but that’s a little misleading because you’re then comparing non-top-of-the-line haswells with top-of-the-line skylake.
I’m really curious what the difference actually turns out to be. Can you post some actual ruby benchmark numbers?


